
Appearance
The sales dashboard
Reports answers how the center is doing over a period: what you sold, to how many people, and which services brought the money in.
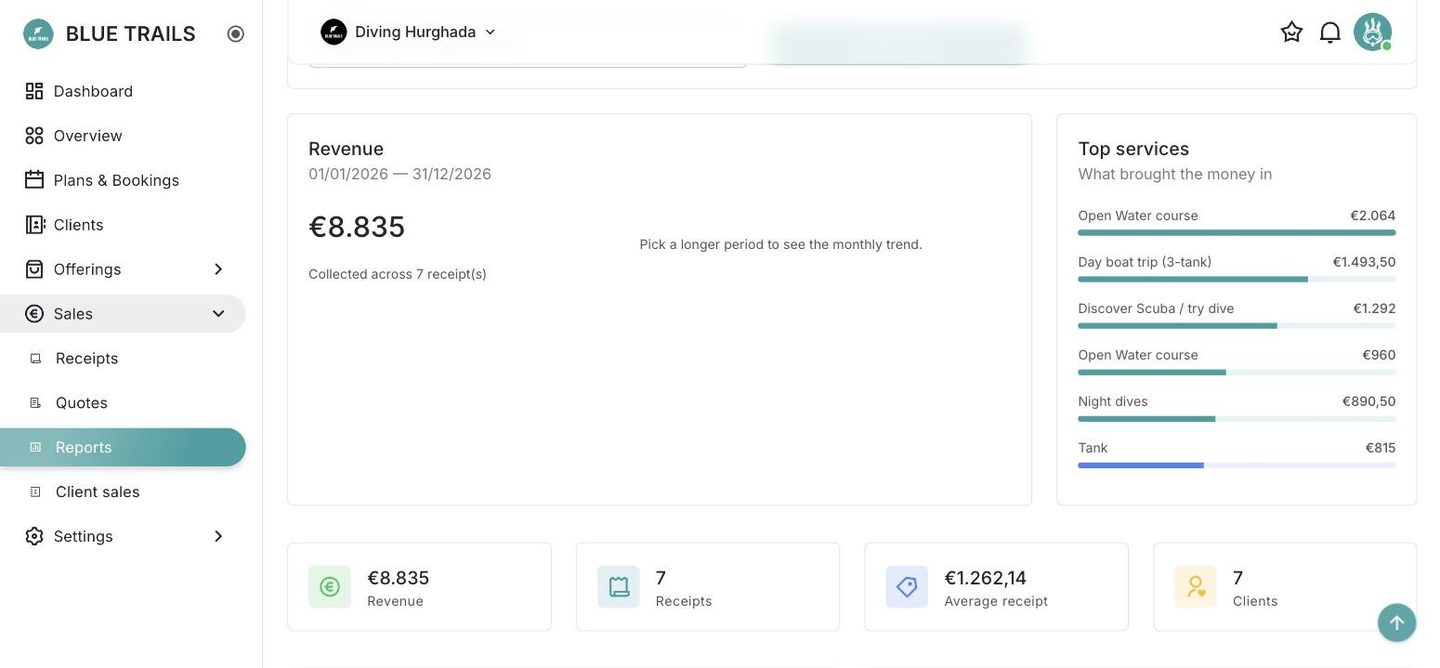
It is built from charged receipts
The source is receipts that have been paid, with the period measured on the payment date. A charged receipt never changes, so a report you read in March still says the same thing in August. That is the whole point of it: a period you can close.
What each number answers
| Metric | The question |
|---|---|
| Revenue, with its breakdown and the monthly curve | How the year is coming along |
| Receipts | How many sales, which with revenue gives you the shape of them |
| Average receipt | How much each sale leaves. Two centers with the same revenue and a different average are two different businesses |
| Clients | How many different people came through |
| Top services | Where the money actually comes from, which is what decides what to push |
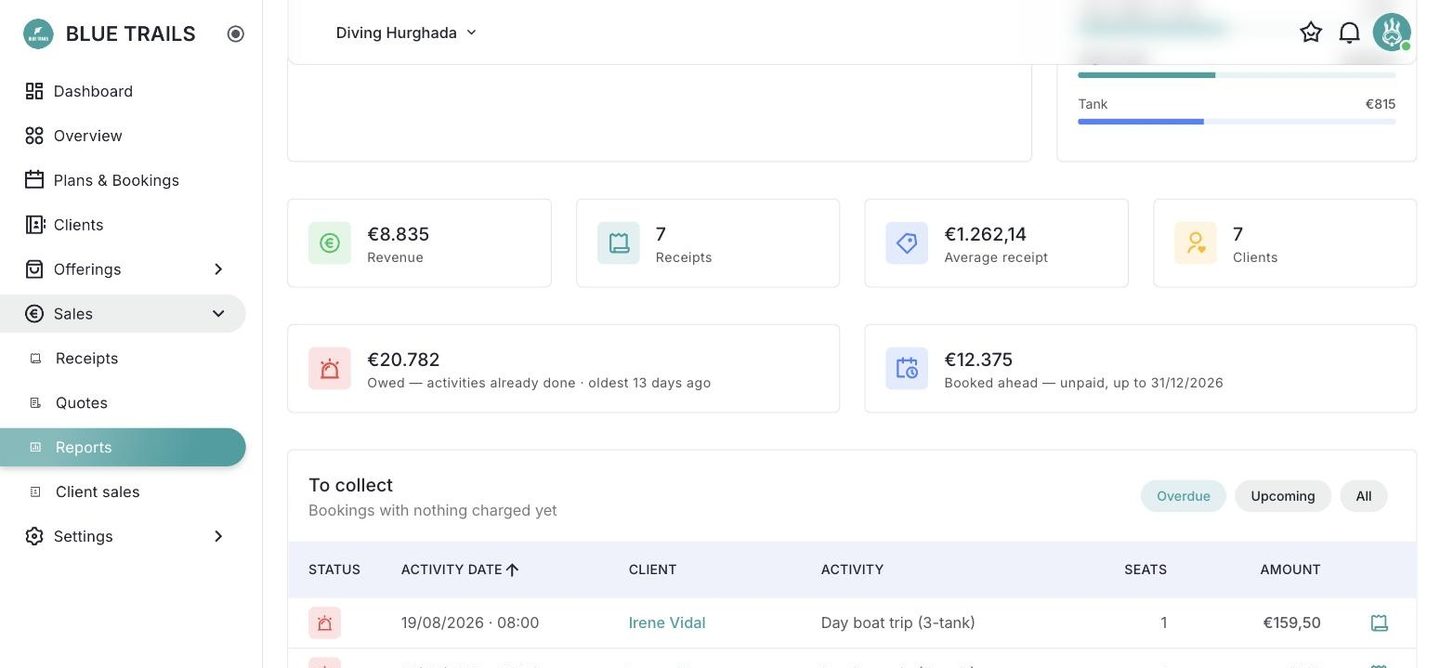
What is deliberately not here
What is still to be collected. Everything on this screen has already been paid, so there is no "pending" to show against it — and unpaid money is not a sale belonging to any month, it is a balance as of today.
That lives in Client sales, on its own, which is what stops the two totals from being compared when they cannot be.
Recent sales
The last ten, newest first. It is a glance at what is coming in, not an export: the totals above are calculated over the whole period on the server, so a short list underneath never means a short total.